Agents & Insights
Let Astervis watch your metrics and coach your team.
You can't sit on every call or stare at the dashboard all day. Astervis can. Once AI analysis is running, the platform turns that stream of transcripts and QA scores into two things a supervisor actually uses: insights — short, evidence-backed cards that tell you what changed today — and agents — monitors you describe in plain language that keep an eye on the numbers and speak up only when something matters.
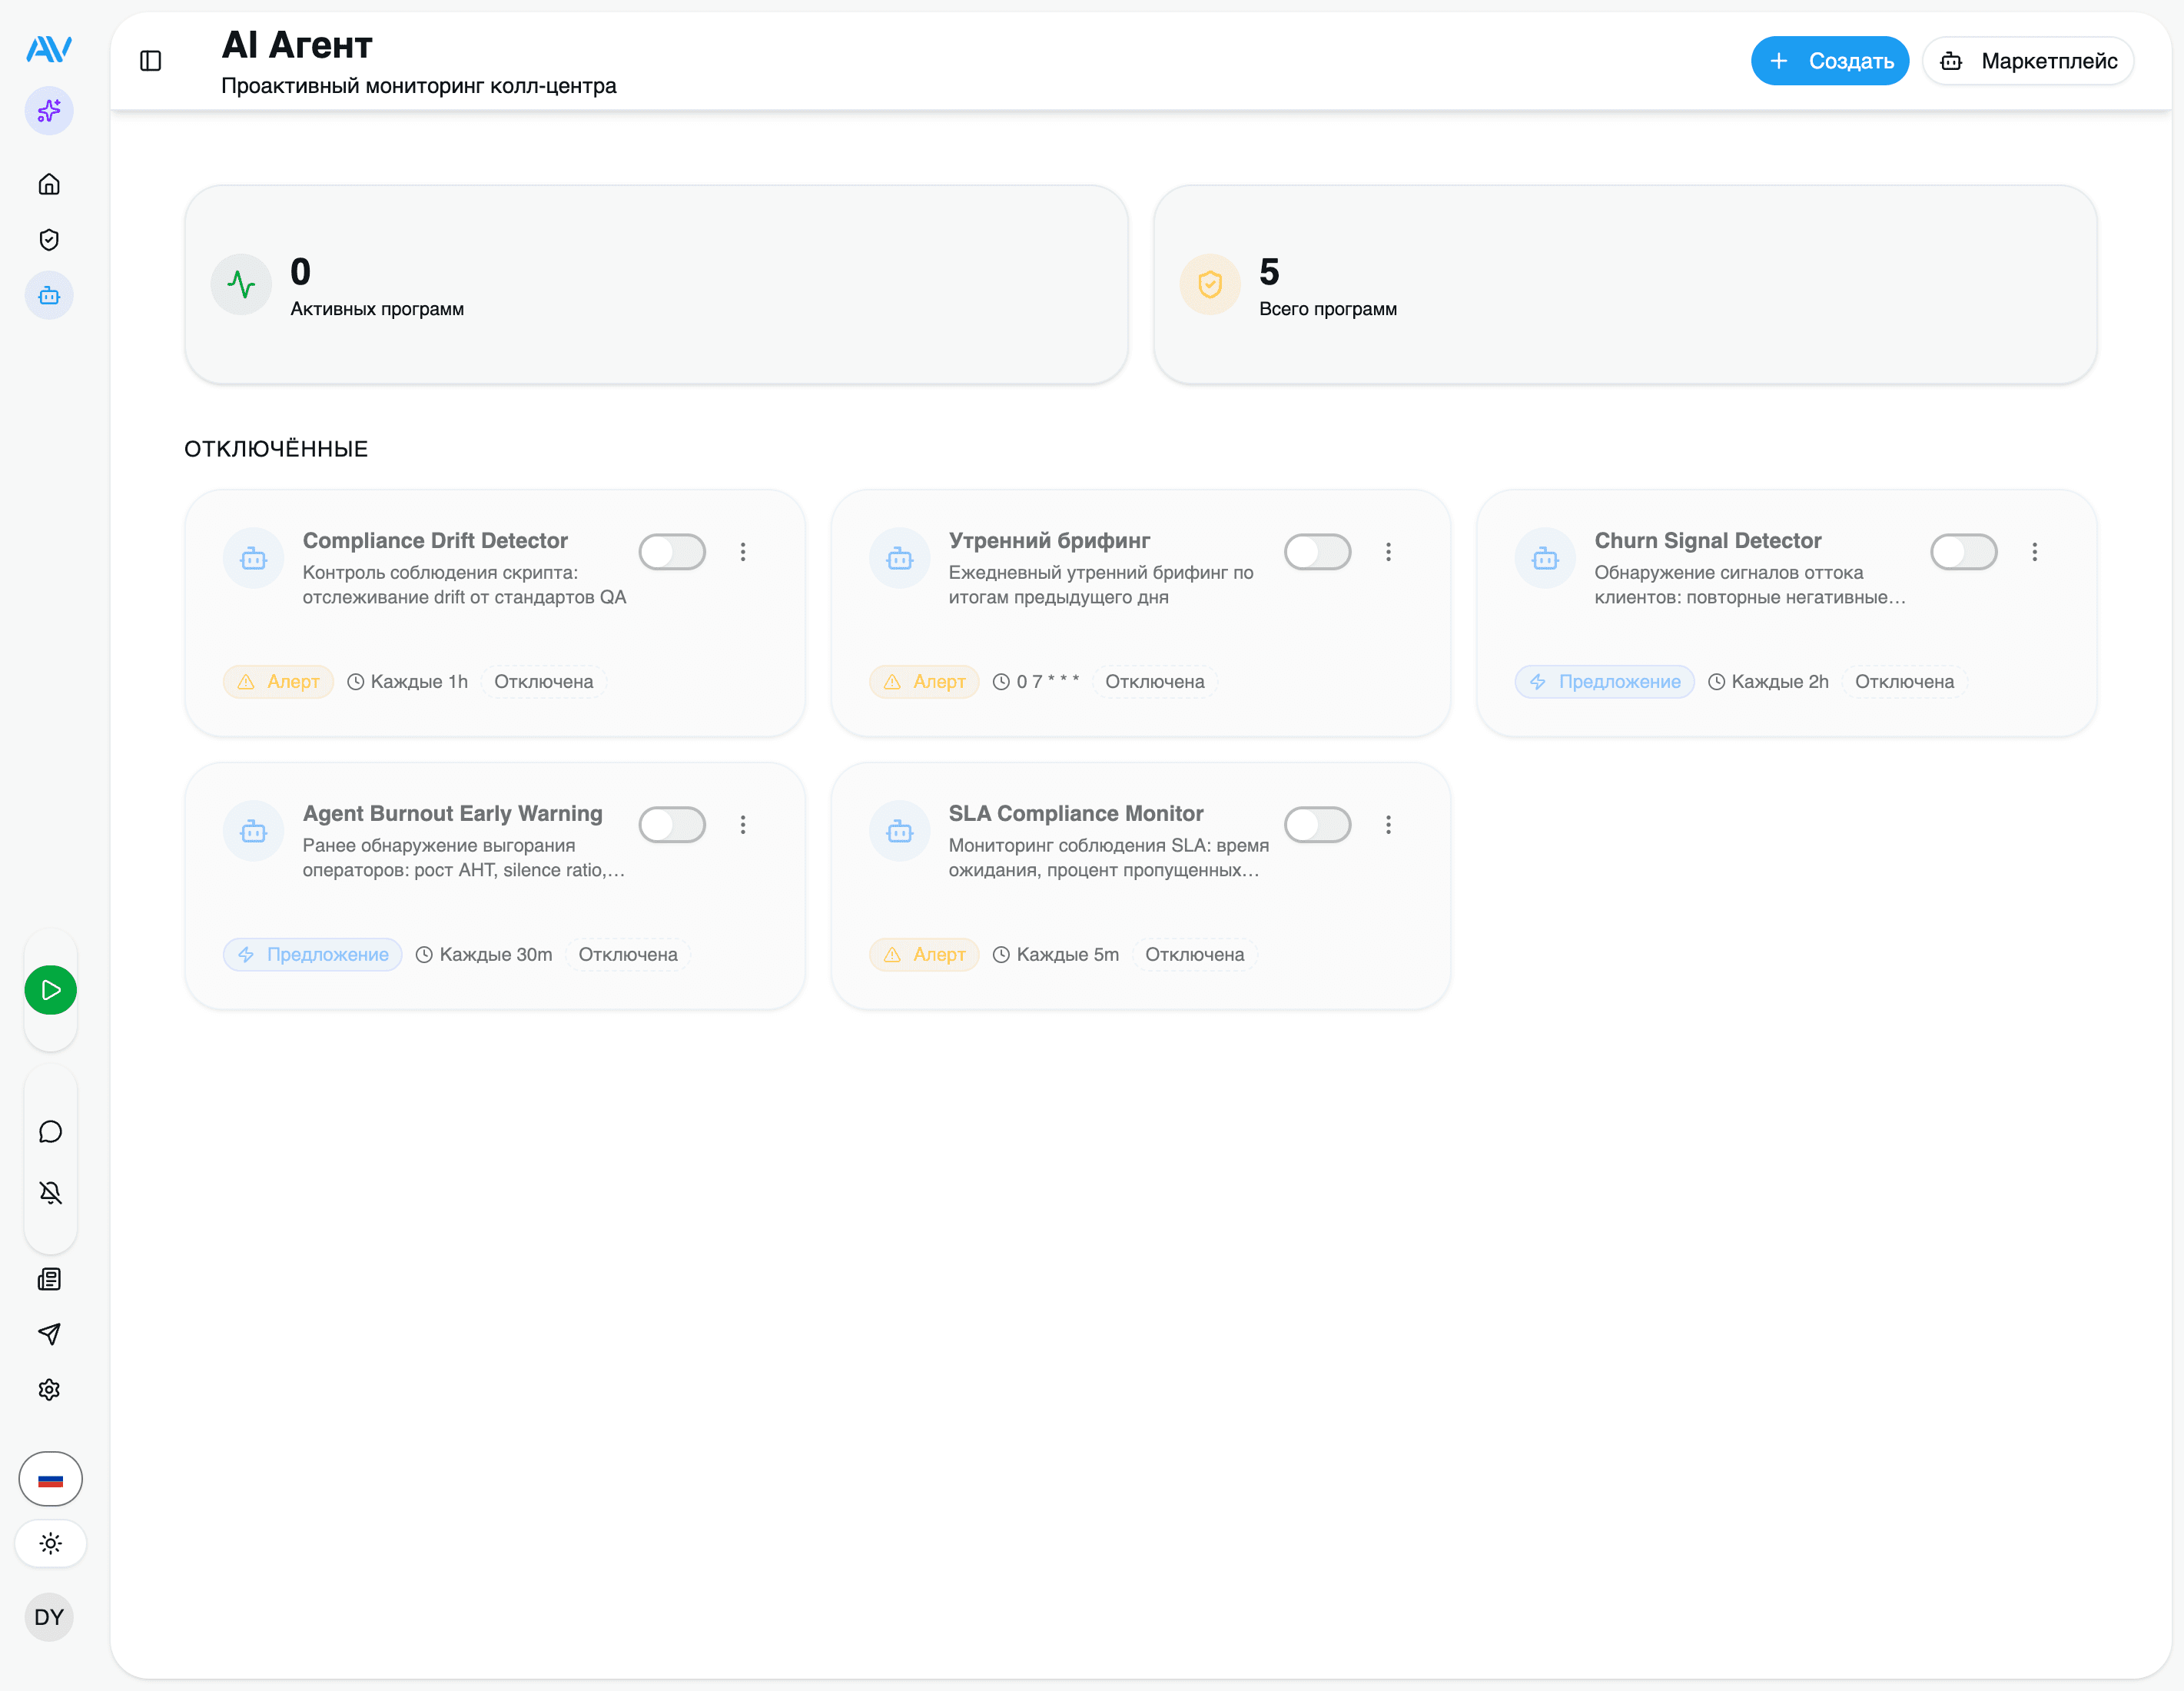
Think of insights as the daily briefing that writes itself, and agents as the night-shift analyst you never had to hire.
Insights and agents run on top of the AI pipeline. If you haven't enabled AI yet, start with AI Call Analytics — there's nothing extra to deploy on your PBX, you just turn it on.
Insights: your automatic daily briefing
Insight templates are deterministic. They don't ask a language model "is anything wrong?" — they run fixed queries against your call data on a schedule and produce a card when a real condition is met. That makes them cheap, fast, and predictable: the same numbers always produce the same insight, and every card is backed by evidence you can click into.
Four templates ship out of the box.
Operator Coach
A daily coaching card per operator: today's QA vs their 30-day baseline, a win to replicate, a coaching opportunity, and their weakest criterion.
Theme Discovery
Surfaces topics that are suddenly spiking — a new complaint, a product question, a competitor name — before they show up in a report.
Anomaly Watch
Catches QA drops, low-performing operators, complaint spikes and negative-sentiment trends, and links straight to the dashboard widget that explains them.
Team Pulse
A team-level health read so you can see the shift at a glance, not just one operator at a time.
Every insight carries its evidence
An insight is never just an assertion. Each card includes the metrics that triggered it (the number, the threshold, the baseline it broke), the call IDs behind it so you can listen to the exact conversations, and verbatim quotes pulled from those calls. A supervisor can go from "complaints are spiking" to hearing the actual customer in two clicks — no spreadsheet archaeology.
Similar insights are bundled, so you see "5 similar this week" instead of five separate cards about the same thing.
The insights inbox lifecycle
Insights land in an inbox, and each one moves through a lifecycle that's tracked per user — so two supervisors looking at the same shift each keep their own read/acted state.
new
A fresh insight has arrived and nobody on your account has looked at it yet.
seen
Someone opened it. It's no longer demanding attention but hasn't been acted on.
acknowledged
You've read it and accept it as real — you're owning it.
resolved
The underlying issue was handled (you coached the operator, the complaint topic was addressed). The card closes out.
dismissed / snoozed
Not relevant right now — dismiss to clear it, or snooze to have it come back later when you've got time to deal with it.
Insights can be delivered to Telegram as they're generated, so your supervisors get the daily Operator Coach card or an Anomaly Watch alert in chat without logging in. The inbox stays the system of record; Telegram is the push.
For the day-to-day flow — triaging the inbox, acting on a card, and managing snoozes — see the user guide.
Agent programs: monitors you describe in plain language
Insight templates answer questions we anticipated for you. Agent programs let you ask your own — in plain language — and have Astervis keep checking the answer on a schedule.
You don't write SQL or pick metrics. You describe the monitor:
"Alert me if any operator's average QA score drops below 70 over a rolling week, and tell me which calls dragged it down."
The AI gateway reads that description and plans the SQL metrics it needs to collect. On every run — its "heartbeat" — it gathers those aggregated metrics, hands them to the model, and the model returns a structured verdict rather than a wall of text:
- status —
ok,alert, orcritical. - confidence —
0–1; the model is encouraged to be honest, so a shaky read says so. - reasoning — why it reached that status, in words you can audit.
- summary — the one-line takeaway.
- alerts — each with a severity, the metric, the value it saw, and the threshold it broke.
- recommended actions — concrete next steps, each with a priority.
Because the verdict is structured, the platform can route it: show it on the agent activity feed, raise an insight, or push it to Telegram — and you can trust the numbers because the metric, value, and threshold are all in the record.
Authority levels: how much an agent is allowed to do
Every agent program runs at one of four authority levels. They escalate from "just tell me" to "go ahead and do it", and you decide how far to trust each one.
| Level | What it does |
|---|---|
| observe | Watches and records verdicts. It never notifies anyone — pure background monitoring you can review on the activity feed. |
| alert | Watches and notifies you when status turns alert or critical (in-app and, if configured, Telegram). |
| suggest | Goes a step further and proposes concrete recommended actions for you to approve and run. |
| act | Can carry out an action on its own — but only through an approval gate. Nothing autonomous happens until that gate is satisfied. |
act always passes through an approval gate. An agent at the act level cannot
silently change anything in your account; the gate is a hard checkpoint that requires
sign-off before an action executes. Start new agents at observe or alert and only
raise authority once you trust a monitor's judgement.
Execution history and audit log
Nothing an agent does is a black box. Each run is recorded with its result, the metrics snapshot it acted on, the confidence, the tokens and cost, and whether delivery succeeded — so you can scroll back and see exactly what the agent saw on any given day.
Alongside that runs a compliance audit log capturing the meaningful events —
heartbeat_ok, alert_sent, escalation_triggered, approval_requested — which is what
you'll want when someone asks "why did this monitor page us at 2am?" or during a review.
The agent marketplace
You don't have to write every monitor from scratch. The marketplace is a catalog of prebuilt agent templates organised by category — QA watchdogs, complaint monitors, operator-performance trackers and more. Clone one, point it at your queues and thresholds, choose its authority level and delivery channels, and it's live.
Browse the marketplace
Open the agent marketplace and pick a template that's close to what you want to watch.
Clone and tune it
Adjust the plain-language description, thresholds, schedule, and which queues it covers.
Set authority and delivery
Choose observe / alert / suggest / act, and where verdicts go (in-app, Telegram).
Let it run
The agent heartbeats on schedule. Review its verdicts on the activity feed and raise authority as you build trust.
Insights vs. agents — which do I use?
Both watch your metrics; they differ in who decides what to look for.
Use insights when
You want the built-in coaching and anomaly cards with zero setup — Operator Coach, Theme Discovery, Anomaly Watch, Team Pulse, delivered to your inbox and Telegram.
Use an agent when
You have a specific question of your own — a threshold, a queue, a behaviour — and want Astervis to plan the metrics and check it on a schedule, with a verdict and optional actions.
Where to go next
The insights inbox, day to day
Triage, act on, and clear insights as a supervisor.
QA scoring & rubrics
Define the quality rules that feed Operator Coach and your agents.
Assistant & search
Ask analytics questions in plain language across what was actually said.
AI & privacy
What stays on your server, and what's sent for analysis.
Last updated on